Tutorial about filtering LocData objects
%matplotlib inline

import numpy as np
import pandas as pd
import matplotlib.pyplot as plt

import locan as lc
lc.show_versions(system=False, dependencies=False, verbose=False)
Locan:
   version: 0.22.0.dev32+g4bfc3ab8b

Python:
   version: 3.11.14
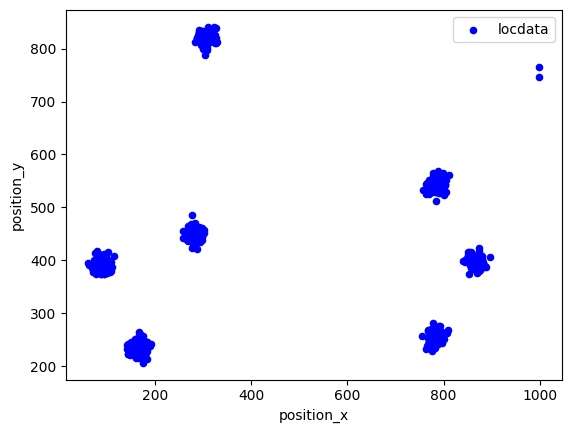
Synthetic data
A random dataset is created.
rng = np.random.default_rng(seed=1)
locdata = lc.simulate_Thomas(parent_intensity=1e-5, region=((0, 1000), (0, 1000)), cluster_mu=100, cluster_std=10, seed=rng)

locdata.print_summary()
Jupyter environment detected. Enabling Open3D WebVisualizer.
[Open3D INFO] WebRTC GUI backend enabled.
[Open3D INFO] WebRTCWindowSystem: HTTP handshake server disabled.
identifier: "1"
comment: ""
source: SIMULATION
state: RAW
element_count: 705
frame_count: 0
creation_time {
  2026-04-30T08:37:39.390718Z
}
fig, ax = plt.subplots(nrows=1, ncols=1)
locdata.data.plot.scatter(x='position_x', y='position_y', ax=ax, color='Blue', label='locdata')
plt.show()
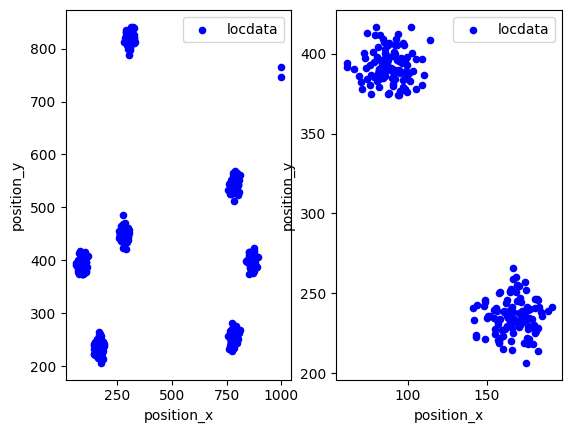
Select localizations according to property conditions
A LocData object carries localization data with certain properties for each localization.
We can select localisations according to property conditions.
locdata_select = lc.select_by_condition(locdata, condition='position_x<200')
fig, ax = plt.subplots(nrows=1, ncols=2)
locdata.data.plot.scatter(x='position_x', y='position_y', ax=ax[0], color='Blue', label='locdata')
locdata_select.data.plot.scatter(x='position_x', y='position_y', ax=ax[1], color='Blue', label='locdata')
plt.tight_layout
plt.show()
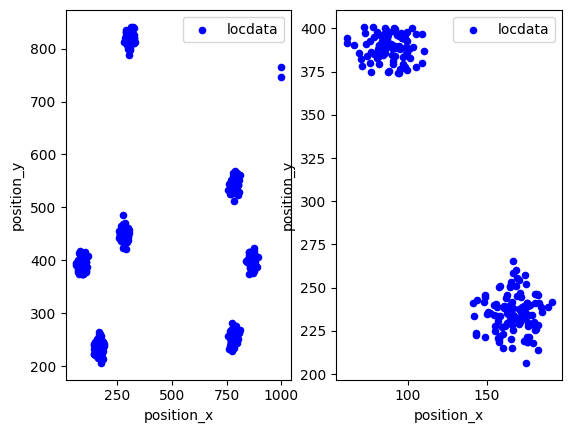
Select localizations in regions
Regions can be defined using the classes defined in the locan.data.region module. Please see the tutorial on Regions.
We can select localizations that within a given region.
region = region=lc.Rectangle((1, 1), 400, 400, 0)
locdata_roi = lc.select_by_region(locdata, region=region)
fig, ax = plt.subplots(nrows=1, ncols=2)
locdata.data.plot.scatter(x='position_x', y='position_y', ax=ax[0], color='Blue', label='locdata')
locdata_roi.data.plot.scatter(x='position_x', y='position_y', ax=ax[1], color='Blue', label='locdata')
plt.tight_layout
plt.show()
Select localizations from a region of interest (ROI)
Typically a region of interest is defined for a single dataset. The Roi class combines a region definition with a specific data reference and provides convenience methods like input/output.
Define a region of interest (roi):
roi = lc.Roi(region=lc.Rectangle((1, 1), 400, 400, 0), reference=locdata)
Create new LocData instance by selecting localizations within a roi.
locdata_roi = roi.locdata()
fig, ax = plt.subplots(nrows=1, ncols=2)
locdata.data.plot.scatter(x='position_x', y='position_y', ax=ax[0], color='Blue', label='locdata')
locdata_roi.data.plot.scatter(x='position_x', y='position_y', ax=ax[1], color='Blue', label='locdata')
plt.tight_layout
plt.show()
Save roi definitions (including region and reference) as yaml file:
roi
Roi(reference=<locan.data.locdata.LocData object at 0x72c0dd662c50>, region=Rectangle((1, 1), 400, 400, 0), loc_properties=())
import tempfile
from pathlib import Path

with tempfile.TemporaryDirectory() as tmp_directory:
    file_path = Path(tmp_directory) / 'roi.yaml'

    roi.to_yaml(path=file_path)

    roi_new = lc.Roi.from_yaml(path = file_path)
    roi_new.reference = roi.reference

locdata_new = roi_new.locdata()
locdata_new.meta
/home/docs/checkouts/readthedocs.org/user_builds/locan/envs/latest/lib/python3.11/site-packages/locan/rois/roi.py:301: UserWarning: The localization data has to be saved and the file path provided, or the reference is lost.
  warnings.warn(
identifier: "5"
source: SIMULATION
state: MODIFIED
history {
  name: "make_Thomas"
  parameter: "{\'parent_intensity\': 1e-05, \'region\': ((0, 1000), (0, 1000)), \'expansion_factor\': 6, \'cluster_mu\': 100, \'cluster_std\': 10, \'clip\': True, \'shuffle\': True, \'seed\': Generator(PCG64) at 0x72C0FD467220}"
}
history {
  name: "locdata"
  parameter: "{\'self\': Roi(reference=<locan.data.locdata.LocData object at 0x72c0dd662c50>, region=Rectangle((1, 1), 400, 400, 0),  loc_properties=[]), \'reduce\': True}"
}
ancestor_identifiers: "1"
element_count: 206
frame_count: 0
creation_time {
  seconds: 1777538259
  nanos: 390718000
}
modification_time {
  seconds: 1777538259
  nanos: 390718000
}
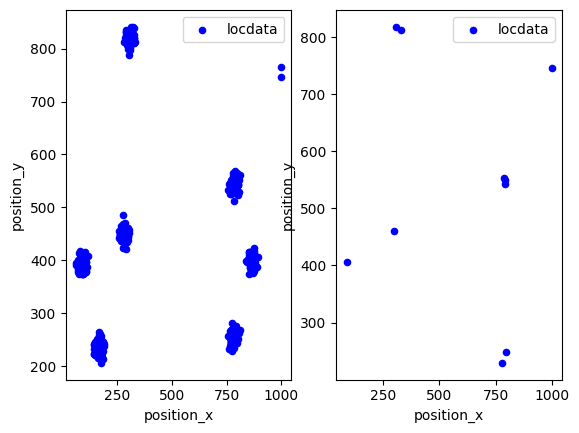
Select a random subset of localizations
locdata_random = lc.random_subset(locdata, n_points=10, seed=rng)
fig, ax = plt.subplots(nrows=1, ncols=2)
locdata.data.plot.scatter(x='position_x', y='position_y', ax=ax[0], color='Blue', label='locdata')
locdata_random.data.plot.scatter(x='position_x', y='position_y', ax=ax[1], color='Blue', label='locdata')
plt.tight_layout
plt.show()