Tutorial about nearest neighbor distances
from pathlib import Path

%matplotlib inline

import matplotlib.pyplot as plt

import locan as lc
lc.show_versions(system=False, dependencies=False, verbose=False)
Locan:
   version: 0.22.0.dev32+g4bfc3ab8b

Python:
   version: 3.11.14
# A path in which test data can be found:
TEST_DIR: Path = Path.cwd().parents[2] / "tests"
TEST_DIR
PosixPath('/home/docs/checkouts/readthedocs.org/user_builds/locan/checkouts/latest/tests')
Load rapidSTORM data file
Identify some data in the test_data directory and provide a path using pathlib.Path
path = TEST_DIR / 'test_data/rapidSTORM_dstorm_data.txt'
print(path, '\n')

dat = lc.load_rapidSTORM_file(path=path, nrows=1000)
/home/docs/checkouts/readthedocs.org/user_builds/locan/checkouts/latest/tests/test_data/rapidSTORM_dstorm_data.txt
Jupyter environment detected. Enabling Open3D WebVisualizer.
[Open3D INFO] WebRTC GUI backend enabled.
[Open3D INFO] WebRTCWindowSystem: HTTP handshake server disabled.
Print information about the data:
print(dat.data.head(), '\n')
print('Summary:')
dat.print_summary()
print('Properties:')
print(dat.properties)
   position_x  position_y  frame  intensity  chi_square  local_background
0     9657.40     24533.5      0   33290.10   1192250.0        767.732971
1    16754.90     18770.0      0   21275.40   2106810.0        875.460999
2    14457.60     18582.6      0   20748.70    526031.0        703.369995
3     6820.58     16662.8      0    8531.77   3179190.0        852.789001
4    19183.20     22907.2      0   14139.60    448631.0        662.770020

Summary:
identifier: "1"
comment: ""
source: EXPERIMENT
state: RAW
element_count: 14
frame_count: 1
file {
  type: RAPIDSTORM
  path: "/home/docs/checkouts/readthedocs.org/user_builds/locan/checkouts/latest/tests/test_data/rapidSTORM_dstorm_data.txt"
}
creation_time {
  2026-04-30T08:35:18.759386Z
}

Properties:
{'localization_count': 14, 'position_x': np.float64(15873.847142857145), 'uncertainty_x': np.float64(2361.4490857013648), 'position_y': np.float64(17403.909285714286), 'uncertainty_y': np.float64(1803.9975262697349), 'intensity': np.float64(183987.66999999998), 'local_background': np.float32(675.0614), 'frame': np.int8(0), 'region_measure_bb': np.float64(730882123.3259), 'localization_density_bb': np.float64(1.915493559521281e-08), 'subregion_measure_bb': np.float64(108337.2)}
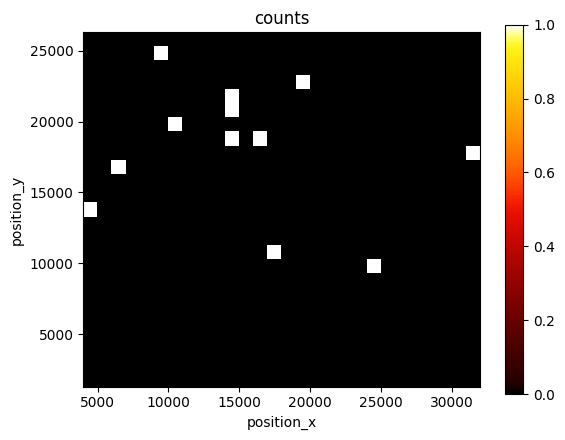
Visualization
lc.render_2d(dat, bin_size=1000, rescale=(0,100));
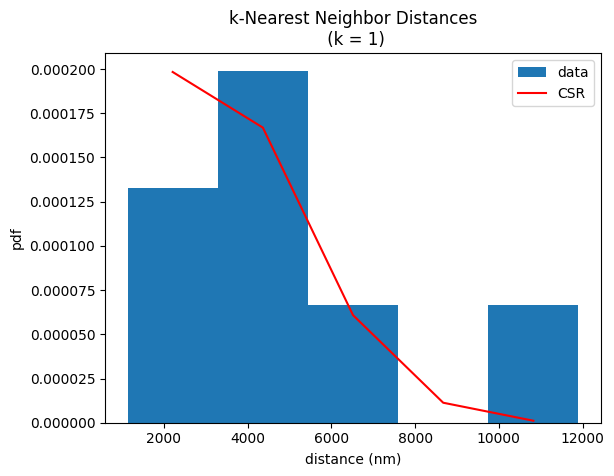
Analyze nearest neighbor distances
The k-nearest neighbor distances can be analyzed for all localizations or a random subset.
nn = lc.NearestNeighborDistances()
nn.compute(dat)
nn.results.head()
| nn_distance | nn_index | |
|---|---|---|
| 0 | 4219.766477 | 12 |
| 1 | 2304.930812 | 2 |
| 2 | 2291.302095 | 9 |
| 3 | 3974.974397 | 10 |
| 4 | 4797.193422 | 1 |
The histogram shows the experimental distribution and for comparision the expectation for a spatial distribution of complete spatial randomness given the experimental localization density (per default relative to the minimum bounding box region).
nn.hist();
The localization_density relative to the minimum bounding box region is retweated by the localization_density attribute.
nn.localization_density
np.float64(1.915493559521281e-08)
Meta data for the analysis procedure
nn.meta
identifier: "1"
method {
  name: "NearestNeighborDistances"
  parameter: "{\'k\': 1}"
}
creation_time {
  seconds: 1777538119
  nanos: 677727000
}