Tutorial about localizations per frame
from pathlib import Path

%matplotlib inline

import matplotlib.pyplot as plt

import locan as lc
lc.show_versions(system=False, dependencies=False, verbose=False)
Locan:
   version: 0.22.0.dev32+g4bfc3ab8b

Python:
   version: 3.11.14
# A path in which test data can be found:
TEST_DIR: Path = Path.cwd().parents[2] / "tests"
TEST_DIR
PosixPath('/home/docs/checkouts/readthedocs.org/user_builds/locan/checkouts/latest/tests')
Load rapidSTORM data file
Identify some data in the test_data directory and provide a path using pathlib.Path
Or get data with more localizations:
dat = lc.load_tubulin()
Jupyter environment detected. Enabling Open3D WebVisualizer.
[Open3D INFO] WebRTC GUI backend enabled.
[Open3D INFO] WebRTCWindowSystem: HTTP handshake server disabled.
Print information about the data:
print(dat.data.head(), '\n')
print('Summary:')
dat.print_summary()
print('Properties:')
print(dat.properties)
     position_x    position_y  frame     intensity  chi_square  \
0   9937.400391  16751.300781      0  40501.601562   3744920.0
1   9998.709961  12022.799805      0  36280.300781  14295400.0
2   9566.769531   8078.229980      0  29984.000000  12302200.0
3  15492.500000  10120.400391      0  38488.300781   3219820.0
4   6381.459961  16057.700195      0  37093.300781   1620450.0

   local_background
0        709.413025
1        800.455017
2        890.807007
3        495.067993
4        476.035004

Summary:
identifier: "7"
comment: ""
source: EXPERIMENT
state: RAW
element_count: 1506568
frame_count: 74969
file {
  type: ASDF
  path: "/home/docs/LocanDatasets/tubulin_cos7.asdf"
}
creation_time {
  2026-04-30T08:35:13.543245Z
}

Properties:
{'localization_count': 1506568, 'position_x': np.float64(8833.605738466662), 'uncertainty_x': np.float64(4.053253266247036), 'position_y': np.float64(10446.826432598386), 'uncertainty_y': np.float64(3.278383909327508), 'intensity': np.float32(19965508000.0), 'local_background': np.float32(284.22076), 'frame': np.int32(0), 'region_measure_bb': np.float32(289612320.0), 'localization_density_bb': np.float32(0.0052020163), 'subregion_measure_bb': np.float32(68072.0)}
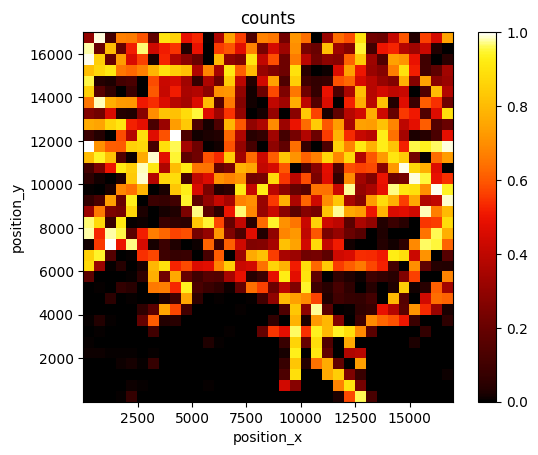
Visualization
lc.render_2d(dat, bin_size=500, rescale=lc.Trafo.EQUALIZE_0P3);
Analyze localizations per frame
We have a look at the number of localizations that were detected in each frame.
The analysis class Localizations_per_frame provides numerical results, a plot of results versus frame, and a density graph (histogram).
lpf = lc.LocalizationsPerFrame()
lpf.compute(dat)
LocalizationsPerFrame(norm=None, time_delta=integration_time, resample=None)
lpf.results
<locan.analysis.localizations_per_frame._Results at 0x76bf1e332a50>
print(lpf.results.time_series.head())
frame
0    76.0
1    72.0
2    71.0
3    68.0
4    71.0
Name: n_localizations, dtype: float64
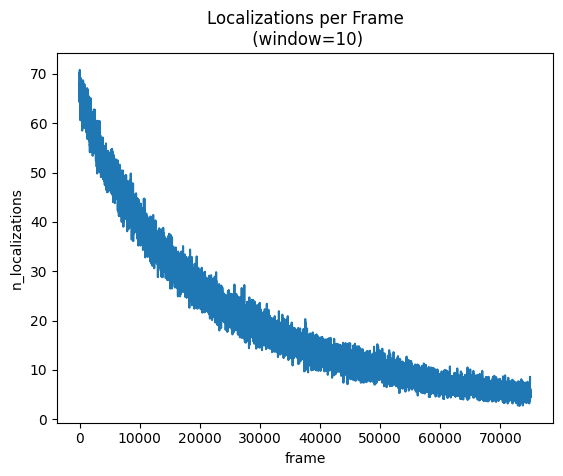
The plot shows results smoothed by a running average according to the specified window.
lpf.plot(window=10);
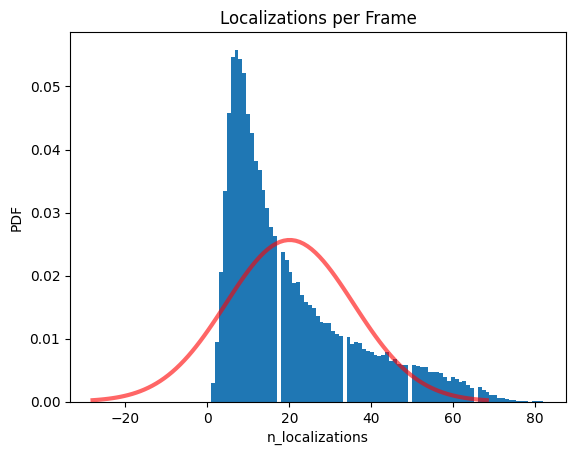
The histogram per default provides automatic bins, is normalized to show a probability density function and estimates a normal distribution.
lpf.hist();
The accumulation time is the time at which fraction of the cumulative intensity is reached.
lpf.results.accumulation_time()
np.int64(17078)
Plot normalized values
We can normalize the number of localizations to any other LocData property.
dat.properties
{'localization_count': 1506568,
 'position_x': np.float64(8833.605738466662),
 'uncertainty_x': np.float64(4.053253266247036),
 'position_y': np.float64(10446.826432598386),
 'uncertainty_y': np.float64(3.278383909327508),
 'intensity': np.float32(19965508000.0),
 'local_background': np.float32(284.22076),
 'frame': np.int32(0),
 'region_measure_bb': np.float32(289612320.0),
 'localization_density_bb': np.float32(0.0052020163),
 'subregion_measure_bb': np.float32(68072.0)}
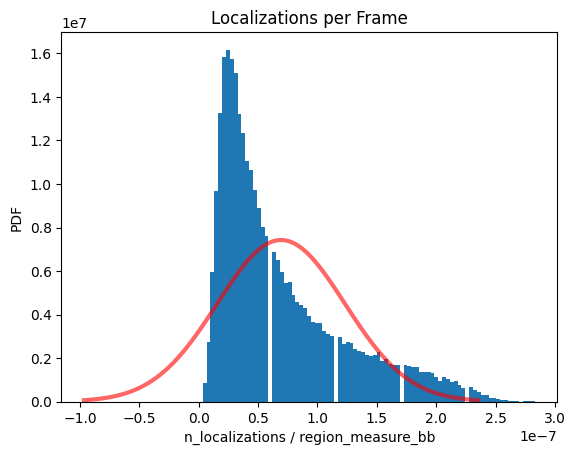
lpf = lc.LocalizationsPerFrame(norm='region_measure_bb').compute(dat)
lpf.hist();